
Friday, October 21, 2011
BIG Increase in M2

from groovy girl: Zerohedge reports this morning that the US Money Supply has surged 33% in the past four months. Click here.
And what happened four months ago to cause Ben and his pet banks to “print” more money? The European Debt Crisis started moving to the European banks and US banks, and we had a run on the money market funds causing a huge loss of liquidity for the system. This is QExx under the table for Europe and US Banks exposed to Europe.
Once again, huge amounts of US dollars are being created to try a bailout all global debt problems. It will not work. What it will do is push price inflation first higher in non-US countries and then in the US.
More US dollars in the world monetary system creates a situation where those US dollars will come flooding back to US soil when the rest of the world loses confidence in the dollar. Groovygirl has a feeling that the “powers that be” will not reorganize the global fiat money system until the US is feeling the pain of hyperinflation. By that time, all other nations will already be knee-deep in hyperinflation and the global debt problem will still not be solved.
Be prepared.
FXI 2005 - 11

For some perspective on one of the more important global stock markets, today's chart focuses on Chinese stocks and presents the current trend of the iShares FTSE/Xinhua China 25 Index (FXI). As today's chart illustrates, Chinese stocks have endured what amounts to an extremely wild ride since 2005. The FXI trended upward at an ever accelerating rate (i.e. parabolic) from 2005 to Q4 2007. As the credit bubble began to unravel, so too did Chinese stocks with the FXI trending downward at an ever accelerating rate from Q4 2007 to Q4 2008. Beginning in Q4 2008, the FXI surged -- gaining over 155% trough to peak. Since that post-financial crisis peak back in Q4 2010, Chinese stocks initially treaded water but more recently have entered in to a steep downward trend channel. Considering China's increasingly significant contribution to the global economy, this recent stock market action is most definitely a red flag.
Thursday, October 20, 2011
5 page quarterly forecast -- great report
http://www.hoisingtonmgt.com/pdf/HIM2011Q3NP.pdf
Negative economic growth will probably
be registered in the U.S. during the fourth
quarter of 2011, and in subsequent quarters in
2012. Though partially caused by monetary
and fiscal actions and excessive indebtedness,
this contraction has been further aggravated by
three current cyclical developments: a) declining
productivity, b) elevated inventory investment,
and c) contracting real wage income.
Tuesday, October 18, 2011
Trade Deficit vs. GDP

from Business Insider Chart of the Day:
As part of this morning's trade balance report, the July trade deficit was revised wider from $44.8 billion to $45.6 billion.
Since the trade deficit gets subtracted from GDP, this is seen as a negative. ZeroHedge expects coming down ard revisions to Q3 GDP estimates.
That may be possible, but this misses the big picture.
Wide trade deficits are a sign of more robust growth.
Here's a chart going back a long way that shows that nicely.
When the trade deficit is shrinking, GDP tends to shrink too, and when it's widening, GDP widens too, even if the trade deficit comes out of GDP
Monday, October 17, 2011


Thursday, October 6, 2011
Economist -- nice overview
Excellent article -- worth a full read (it's not that long, even!)
last paragraph: In 2008 governments were credible backstops for their banks and the Fed, the central bank at the heart of the crisis, was willing to do everything it could to create confidence. Now the sovereigns are the problem and the ECB’s help is limited and conditional. That is the real horror film.
http://www.economist.com/node/21531467?fsrc=nlw|edh|09-29-11|editors_highlights
Wednesday, October 5, 2011
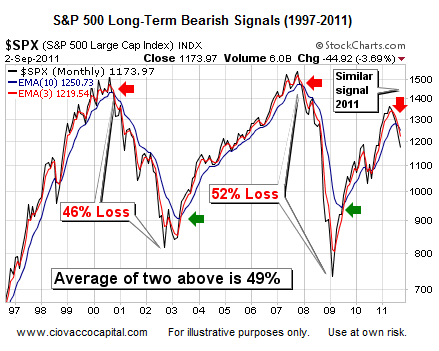
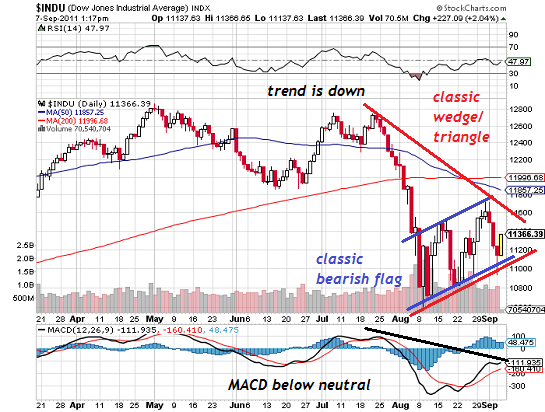
The Technical Evidence for a Bear Market Decline
Great Charts here! Source
What is the technical evidence for a Bull or Bear market? If we keep it simple, the evidence is solidly Bearish.
What is the technical evidence for a Bull or Bear market? If we keep it simple, the evidence is solidly Bearish.
Robert Reich blog post
Follow the Money: Behind Europe’s Debt Crisis Lurks Another Giant Bailout of Wall Street
TUESDAY, OCTOBER 4, 2011
Today Ben Bernanke added his voice to those who are worried about Europe’s debt crisis.
But why exactly should America be so concerned? Yes, we export to Europe – but those exports aren’t going to dry up. And in any event, they’re tiny compared to the size of the U.S. economy.
If you want the real reason, follow the money. A Greek (or Irish or Spanish or Italian or Portugese) default would have roughly the same effect on our financial system as the implosion of Lehman Brothers in 2008.
Financial chaos.
Monday, October 3, 2011
Normal Deleveraging Recession
from Jason Kelly
This is not news to longtime readers, but it’s worth remembering that we knew from the beginning this recession would drag on because it was not caused by a normal business cycle but by deleveraging after bad debt — with both rapacious banks and stupid borrowers to blame. Morgan Housel provides a good recap of this point:
Prophets Of Doom: 12 Shocking Quotes + 1 I found
12 below, but here's another: "The markets are focused on the imminent default by Greece. But, this is not the most important issue now. The historic development the markets have not priced in as that Germany is preparing to exit the Euro. The markets are very likely to have to contend with the re-introduction of Deutsche Marks in the near future. This is bound to mean a collapse in the value of the Euro for those countries that will remain in it (devaluation for the rest of Europe). This step may seem unthinkable but, I believe that the German government is telling us in multiple ways that there is no other solution from their point of view."
-- This is from Pippa Malmgren -- smart enough that she worked for the Bush White House (her bio)
From The Economic Collapse Blog (nice title) & reposted by zerohedge
-- This is from Pippa Malmgren -- smart enough that she worked for the Bush White House (her bio)
From The Economic Collapse Blog (nice title) & reposted by zerohedge
The following are 12 shocking quotes from insiders that are warning about the horrific economic crisis that is almost here....
#1 George Soros: "Financial markets are driving the world towards another Great Depression with incalculable political consequences. The authorities, particularly in Europe, have lost control of the situation."
#2 PIMCO CEO Mohammed El-Erian: "These are all signs of an institutional run on French banks. If it persists, the banks would have no choice but to delever their balance sheets in a very drastic and disorderly fashion. Retail depositors would get edgy and be tempted to follow trading and institutional clients through the exit doors. Europe would thus be thrown into a full-blown banking crisis that aggravates the sovereign debt trap, renders certain another economic recession, and significantly worsens the outlook for the global economy."
Friday, September 30, 2011
Goldrunner forecast
http://www.gold-eagle.com/editorials_08/goldrunner092611.html

The following Gold Chart shows that the cyclical tendency since early 2009 has been for Gold to bottom at the green arrows with Gold correcting down to and through the dotted Bollinger Band (BB) mid-line to hit the 34 week exponential moving average while the RSI Indicator approaches the 50 line. Gold fell to the BB mid-line on Friday as the RSI approached the 50 line. Black rays off of the 2008 top show that Gold has been bottoming at each black line extended over the "last top." Gold reached that juncture on Friday. We might see Gold weakness early next week, but we expect the basic relationship to hold. Near this point in the 70's Gold Chart, an imminent bottom produced a sharp rise.
Growth Correlations
A chart from Citi shows the rising correlation of regional economic growth to the global aggregate. For the past decade all regions have been moving in harmony, with correlation peaking right about now. Globalized trade, cross-border financial links and faster-moving information have all contributed to the trend. One major outcome of high correlation is volatility.

Thursday, September 22, 2011
Mister Bear Takes A Look At Gold, Silver & The Dow Jones
great article from Tuesday
Mister Bear Takes A Look At Gold, Silver & The Dow Jones
Wednesday, September 21, 2011
zerohedge on fire today
www.zerohedge.com
- Bank Downgrades Jump The Atlantic: S&P Cuts Italian Intesa Sanpaolo, Mediobanca From A+ To A
- Moody's Goes For Trifecta, Downgrades Citi Short-Term Rating Of Citi From Prime-1 To Prime-2
- Double Tap For Octogenarian Of Omaha: Wells Downgraded From A1 To A2
- Suck It Up Warren - Moody's Downgrades Bank Of America From A2 To Baa1
- 'Twist' Sends Ultra Investors Shouting With 30Y Treasury Yield Back To Jan 2009 Lows
Monday, September 19, 2011
history doesn't repeat itself, but...
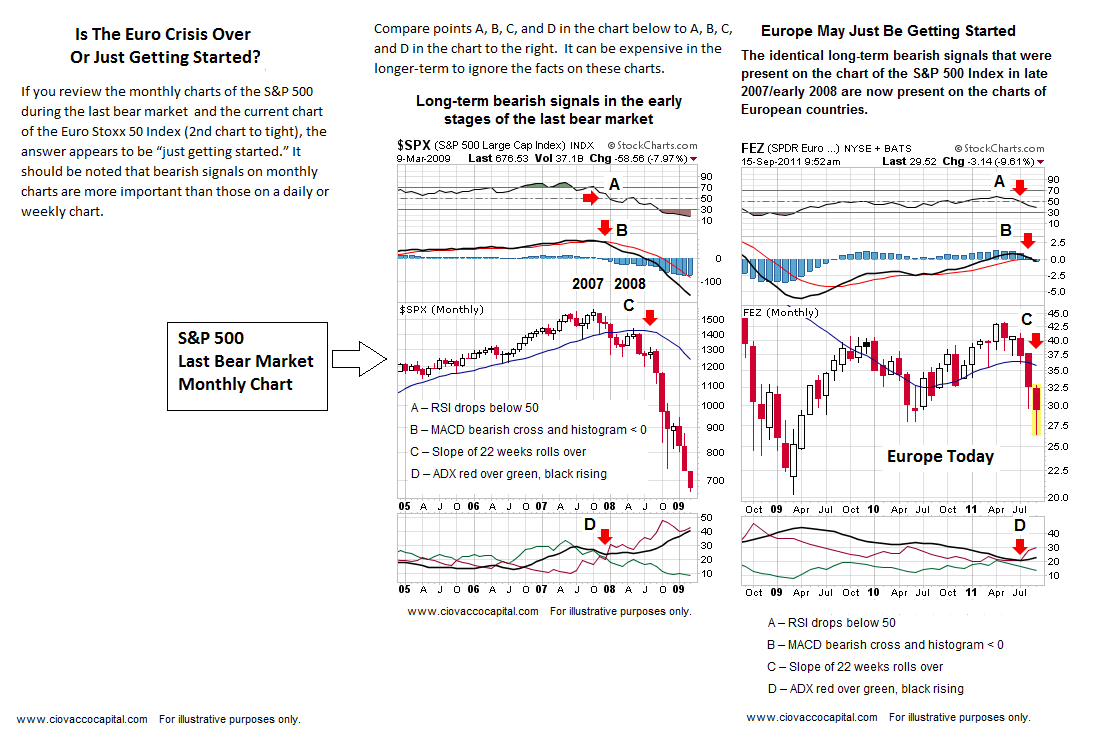
If you review the monthly charts of the S&P 500 during the last bear market (below) and the current chart of the Euro Stoxx 50 Index (2nd chart), the answer appears to be “just getting started.” It should be noted that bearish signals on monthly charts are more important than those on a daily or weekly chart. Recently, the S&P 500 has started to lag the German Index, which has been a bearish signal in the past.


Friday, September 16, 2011
China to 'liquidate' US Treasuries, not dollars
pullout:
The Chinese are clearly vexed with Washington, viewing the Fed's QE as a stealth default on US debt. Mr Li came close to calling America a basket case, saying the picture is far worse than when Ronald Reagan and Margaret Thatcher took over in the early 1980s.
Mr Li, one of three outside academics on China's MPC, described the debt deals on Capitol Hill as "just trying to by time", saying it will not be enough to stop America's "debt dynamic" turning dangerous.
Chart of the Day

With second-quarter earnings largely in the books (99% of S&P 500 companies have reported for Q2 2011), today's chart provides some long-term perspective to the current earnings environment by focusing on 12-month, as reported S&P 500 earnings. Today's chart illustrates how earnings declined over 92% from its Q3 2007 peak to Q1 2009 low which brought inflation-adjusted earnings to near Great Depression lows. Since its Q1 2009 low, S&P 500 earnings have surged (up over 1000%) and currently come in at a level that is greater than what occurred at the peak of the dot-com bubble and very near what occurred at the peak of the credit bubble. It is interesting to note that the original run up in real earnings from Great Depression lows to credit bubble highs took over 78 years. The current spike has taken 26 months.
Thursday, September 15, 2011
Ciovacco Capital Management
http://www.ciovaccocapital.com/sys-tmpl/ccmbmsipublic/ -- new market analyst I'm going to track for a while. Lots of interesting charts and stuff. Today's post (TA re. Euro spdr compared to US '08) One recent chart:
Wednesday, September 14, 2011
Effects of Glass-Steagall repeal
All eyes still on Europe, but once the calamity happens there, we get our turn & we have 4 TBTF banks.
from groovygirl:
"Very clearly shows the impact of the repeal of Glass–Steagall Act of 1933 (was signed into law in 1999). Internet Bubble burst early 2001 compounded by 9-11. Final creation of formal “too big to fail” banks happened in 2008-2009. Chart also shows that 1990′s were not as productive as once thought. Financial industry just consolidated, they didn’t really expand."

Tuesday, September 13, 2011
Truth & rumors
Dutch Finance Ministry Says Greek Default Is Unavoidable, Immediately Retracts
China Premier Wen Jiabao Dampens Speculation on China Saving Europe with Statement "Debt-Laden Economies Must First Put Their Own Houses in Order"
Serious recession threat for U.S.
When do you expect the economic growth to rebound and stabilise?
The slowdown pressure will definitely remain till December across the spectrum. There can only be a rebound early next year but that will largely depend on the policy decisions the large economies take in the next few weeks.
The problem is this slowdown is happening within couple of years of huge recession and the world has not recovered fully from the 2008 crisis.And, the ECRI Weekly Leading Index from last week: WLI Ticks Up, but Growth Weakens

Europe -- CDS and yields
PIIGS credit default swap info, from MarketTicker: "CDS spreads on the PIIGS (composite), ...is up an astounding 60% today"

And from Mish, bond yields:
"On a spread-basis, the only country whose yields have collapsed is Ireland.
Italy, Belgium, France and Spain are at or close to spread highs. Also note how France is creeping up.
On 1-year spreads, Italy, Spain, and Belgium are at new highs, suggesting the ECB is losing the containment war on Italian bond yields."


Monday, September 12, 2011
past, present, future

A NEW book, discussed in this week's Economics focus, by Arvind Subramanian of the Peterson Institute for International Economics argues that China’s economic might will overshadow America’s sooner than people think. Mr Subramanian combines each country’s share of world GDP, trade and foreign investment into an index of economic “dominance”. By 2030 China’s share of global economic power will match America’s in the 1970s and Britain’s a century before. Three forces will dictate China’s rise, Mr Subramanian argues: demography, convergence and “gravity”. Since China has over four times America’s population, it only has to produce a quarter of America’s output per head to exceed America’s total output. Indeed, Mr Subramanian thinks China is already the world’s biggest economy, when due account is taken of the low prices charged for many local Chinese goods and services outside its cities. China will be equally dominant in trade, accounting for twice America’s share of imports and exports. That projection relies on the “gravity” model of trade, which assumes that commerce between countries depends on their economic weight and the distance between them.

Friday, September 9, 2011
Yield Curves -- Germany going to recession (or just bailout business?)
From Wall Street Transcript, via yahoo (my bolding):
Edward M. Dempsey: The German yield curve is beginning to invert. Yield curves should be positively sloped if all is well since it reflects healthy demand for money. When you get an inverted yield curve, it is a very reliable harbinger of a coming recession. It reflects concerns of an economic slowdown and deflationary period. So now you can have a scenario where if Germany enters recession, and given that Germany is the strongest link in the euro chain, what happens to Greece, Italy, Spain and Portugal? In that kind of a scenario, German public support for the euro can very, very quickly evaporate. Everyone is worried about Greece being kicked out of the euro, but what if you wake up and Germany says, "We are out of the euro"? I don't believe that is outside the realm of possibility.
Image from mish:

Interactive Chart from financial times:

Wednesday, September 7, 2011
Economist looks at Suez traffic vs. world GDP

Running aground
Sep 2nd 2011, 13:56 by The Economist online
An alternative indicator points to a slowing world economy
FURTHER economic strife may be ahead as a swathe of recently released data points to a slowdown in the world economy. This is confirmed by one alternative measure: the amount of cargo passing through the Suez Canal in Egypt. Approximately 8% of the world's international trade is estimated to flow through the canal, so it acts as a good early indicator of the prevailing economic conditions. The average increase in the total weight of cargo passing through the canal was 5.7% in the three months to July, down from 9.5% in December. Making a simple forecast based on the past few months' data suggests that world GDP will fall from 3.8% in the first quarter to 3.3% in the second quarter.
Zack's forecast
http://www.zackswmg.com/pdf/econreport.pdf
selections:
...
Accordingly, we have marked down our forecast of growth signifi cantly, and we now do not expect a return to abovetrend growth until the second half of 2012. That is, the U.S. effectively remains in a “growth recession” for at least another half year while the unemployment rate drifts higher. Even with the boost to growth expected from the reversal of temporary factors that restrained growth over the fi rst half of this year—adverse weather, spiking energy prices, and supply-chain disruptions stemming from the earthquake in Japan—growth over the second half of this year is expected to average only about 2¼%, down from 3.4% in last month’s forecast. Growth is expected to fi rm in 2012, but to a modest 2.8%. This forecast assumes that the persistent forces restraining growth, i.e., the variable headwinds, dissipate sufficiently by 2013 that growth can reach 4% that year.
...
We now expect the U.S. economy will, at best, muddle through until the problems restraining growth get resolved. This implies growth barely at trend through the fi rst half of 2012, i.e. a continuation of the growth recession that began last year. Growth is expected to pick up in the second half of next year to average roughly 3%, but growth for the year as a whole remains only modestly above trend in 2012 at 2.8%. As a result, the unemployment rate is expected to decline only gradually from a peak of 9.3% later this year to 8.7% in the fourth quarter of next year.
...
we expect financial conditions to improve gradually, albeit starting from levels that are not as supportive of aggregate demand as we previously expected. Growth over 2012 is expected to be roughly 2.8%, about ½ percentage point better than over the second half of this year, but nearly ¾ of a percentage point weaker
than we had expected in last month’s forecast. In 2013, we expect GDP growth to accelerate, to 4.1%, as business fixed investment and housing contribute more significantly to the expansion, and as further improvements in labor market conditions and household balance sheets support a modest further acceleration in consumer spending.
...
Firms remain flush with cash and borrowing costs remain near historic lows. Investment in nonresidential structures, which has been particularly hard hit, appears to be turning up and so will swing from being a drag on GDP growth to being a modest contributor. More important to the big picture is the continued strength in equipment and software investment. Business spending on computers and software rose 21.4% at an annual rate in the second quarter, and is expected to continue to rise at low double-digit rates over the next couple of years.
...
recent developments suggest that the European sovereign debt crisis will keep uncertainty high for some time and that this will depress the prices of risky assets relative to our recent forecasts. This is evident in the wider risk spreads and weaker stock prices in this forecast relative to prior projections. Indeed, if the US economy does end up slipping into recession, the most obvious and likely cause is a significant meltdown in Europe.

Tuesday, September 6, 2011
Europe -- The Final Countdown
20 Quotes From European Leaders That Prove That They Know That The Financial System In Europe Is Doomed
Mish has a good post about the good times in Europe right now
Not only that, but it's messing up the U.S. markets: From zerohedge:


check out this for euro/us gold play
Friday, September 2, 2011
European Banking crisis
another Ambrose Evans-Pritchard gem:


Central bank flight to Federal Reserve safety tops Lehman crisis
A key warning signal of global financial stress has shot above the extreme levels seen at the height of the Lehman crisis in 2008.
Cutout:
Data from the St Louis Fed shows that reserve funds from "official foreign accounts" have doubled since the start of the year, with a dramatic surge since the end of July when the eurozone debt crisis spread to Italy and Spain.
"This shows a pervasive loss of confidence in the European banking system," said Simon Ward from Henderson Global Investors. "Central banks are worried about the security of their deposits so they are placing the money with the Fed."
Europe Grinds to a Halt?

Europe Grinds To A Halt
Eurozone PMI plunged to a two-year low this morning, indicating a worse-than-expected slowdown and triggering declines for the euro on easing expectations.
Manufacturing PMI -- regarded as an early indicator of recession -- fell to 49.0 in August from 50.4 in July, indicating that while GDP is still expanding manufacturing is stalled.
According to Credit Suisse, inventories are at their highest since December 2008, but the lack of demand for goods means that manufacturers will probably have to cut production to reduce overhead in the months ahead. If we regard this orders-to-inventories statistic as an early indicator for manufacturing PMI and ISM, then we're likely to see these numbers slip further over the next few months
Thursday, September 1, 2011
QE2 vs QE3?
Great zerohedge article about the difference between QE2 and the inevitable (?) QE3. Read it!
Slowdown? / Focus is on Europe!
ITALY: Bank of Italy warns on growth as bond sale falters -- Reuters
EURO BANKS 1: WSJ article (need login, but even if you don't the key point is above the login): In a 54-page report sent to hundreds of Goldman's institutional clients dated Aug. 16, Alan Brazil—a Goldman strategist who sits on the firm's trading desk—argued that as much as $1 trillion in capital may be needed to shore up European banks; that small businesses in the U.S., a past driver of job production, are still languishing; and that China's growth may not be sustainable.EURO BANKS 2: Business Insider article: The Latest on the funding situation at European Banks:
"Regardless of the actual liabilities of these banks, it is doubtful any of them could have planned for this sudden drop in equity. At the same time, earnings aren't picking up the slack. Add that to new fears that the Greek bailout will not go through quickly enough to save Greece from a full-blown default (no selectivity) and the ensuing contagion risks.
The real wild card here is the European Central Bank. It could provide virtually unlimited funds to these banks, but their balance sheets have to be strong enough to qualify for lending. This should not be a problem in France and Germany, but the longer it takes to come out with a viable solution to this crisis, the more likely this problem could be."LIBOR RISE: Finally, a nice Chart from Business Insider about LIBOR rates

Major banks on both sides of the Atlantic are self-reporting higher and higher interbank USD borrowing rates, meaning that funding is getting more expensive in a hurry.
This graph from ZeroHedge demonstrates a sharp rise in the 3-month USD LIBOR -- a benchmark interest rate for short-term borrowing of U.S. dollars -- over the last two months. Every bank detailed saw an increase in its short-term borrowing costs.
Reuters reports that European banks are paying slightly more than the fixed LIBOR rate while U.S. banks slightly less. On the whole, 3-month rates are at their highest since last August.
We keep talking about signs that the funding situation for eurozone banks is going downhill, and this looks like the newest sign that dollars are becoming increasingly expensive. Rising borrowing costs could provoke a credit crunch that would lead to another global slowdown.
Monday, August 29, 2011
US forecast, China Slowdown, gold/bonds compared to 2008, and Germany / EU debt
All eyes on Germany in September. Things are not looking good for Merkel or the German Economy. Here are a bunch of different mini-posts that all point to the same outcome -> this Fall will be "interesting" for lack of a better term, and the next 3 years can be painful.
News from around the world:
News from around the world:
GDP adjusted for CPI
nothing big from Bernanke. Might have to do something sooner rather than later:
From Moneygame: The economy grew by 1% in the second quarter, according to inflation-adjusted preliminary data released by the Bureau of Economic Analysis.
But to most Americans it did not feel like growth.
That's because the inflation adjustment used by the BEA is far more conservative than the Bureau of Labor's consumer price index, which is based on prices paid for goods and services -- i.e. the things that consumers notice.

Thursday, August 25, 2011
Anticipating Bernanke
what will he say?
QE3 is a doubtful forecast. check this Many are thinking the Fed might not go there again.
Other options:
Buying longer end Treasuries -- lower real rates -- bad for dollar, good for gold & possibly stocks
Reduce bank reserve's interest to zero -- force loans/credit
Cap yields on treasuries (short and medium term) -- spur spending / lending
Wednesday, August 24, 2011
Herd mentality?
gold correcting [profit taking, too high?, potential increased margin requirement coming, markets stabilizing? (I think not), testing support?]

Check out this one from money game: Herd mentality has descended upon Wall Street, as S&P 500 stock correlation reaches its highest levels ever. This unseats former records set in 1987, when portfolio insurance strategies caused stocks to tumble in tandem. Analysts have learned to expect high correlation in bear markets, when investors rush to sell off equities. But Felix Salmon has noted that the rise of high-frequency trading and ETFs could mean that high correlation is just part of a larger trend. Either way, this spike in correlation is far from reassuring for markets.
Tuesday, August 23, 2011
shift to Europe
follow the Eurozone: http://macrosnap.blogspot.com/2011/07/interactive-eurozone-chart.html
Also from the Economist: Dylan Grice at Societe Generale is one of the top rated strategists in London who has long argued for an overweight cash and long gold position. He thinks the markets are pushing the central banks to monetise the issue; with the Fed indulging in a third round of QE and the ECB loosening the purse strings to buy unlimited bonds. However, he thinks it may take more of an air of crisis before the authorities finally capitulate; perhaps a big European bank in trouble or if French yields start widening towards Spanish levels.
Also from the Economist: Dylan Grice at Societe Generale is one of the top rated strategists in London who has long argued for an overweight cash and long gold position. He thinks the markets are pushing the central banks to monetise the issue; with the Fed indulging in a third round of QE and the ECB loosening the purse strings to buy unlimited bonds. However, he thinks it may take more of an air of crisis before the authorities finally capitulate; perhaps a big European bank in trouble or if French yields start widening towards Spanish levels.
Subscribe to:
Posts (Atom)